Following up on our previous work on County-Level Relationships Between Risk Factors for Severe COVID-19 and Deaths, we applied similar methods to hospital-level data to explore the relationship between the prevalence of several hospital-level risk factors for severe COVID-19 and corresponding COVID-19 hospitalization rates at those hospitals. We used historical hospital inpatient, emergency department, and ambulatory surgery discharge records for California hospitals to estimate the patient population prevalence of several potential risk factors for developing severe COVID-19. In addition to the risk factors included in the prior analysis, we also included race/ethnicity in these analyses, though patient gender was excluded.
Data preparation
Cumulative numbers of COVID-19 inpatient hospitalizations from Jan 1 to July 27 for each California acute care hospital (272 hospitals had at least one case) were obtained from the state surveillance system. Historical inpatient, emergency department, and ambulatory surgery discharge records from 2016 to 2018 from the Office of Statewide Health Planning and Development (OSHPD) were used to estimate the proportion of patients at each hospital having each Centers for Disease Control and Prevention’s (CDC’s) Risk Factor for COVID-19 based on the presence of corresponding ICD-10 codes on patient discharge records. These served as proxy estimates of the COVID-19 risk factor prevalence in the patient population served by each hospital. The population risk factors coded for each hospital were:
- Chronic lung disease including COPD and moderate to severe asthma (% with diagnosis)
- Serious heart conditions (% with diagnosis)
- Cancer, non-melanoma (% with diagnosis)
- Diabetes (% with diagnosis)
- Chronic kidney disease undergoing dialysis (% with diagnosis)
- Liver disease including hepatitis (% with diagnosis)
- Smoking/tobacco use (% with diagnosis)
- Severe obesity (% body mass index of 40 or higher)
- Age (% age 65 and older)
- Ethnicity (% Hispanic)
- Race:
- Asian (%)
- White (%)
- Black (%)
Modeling strategy
Because of high correlations observed among the hospital-level risk factors (in particular age, severe heart disease, cancer, diabetes, chronic lung disease, chronic kidney disease, and severe obesity were all highly correlated, Pearson’s r ranges from 0.67 to 0.94), separate negative binomial regression models were used to estimate the relationship between each individual risk factor and hospital-level COVID-19 hospitalization rates per discharge. To adjust for differences in hospital patient volumes, the total number of OSHPD discharges at each hospital from 2016 to 2018 was used as an offset in the models so rates of COVID-19 hospitalizations per discharge were analyzed.
Results
The results from the individual negative binominal models are shown in the figure below. Each bar represents the percentage change in COVID-19 hospitalization rates associated with a 1 percentage-point increase in the population prevalence of each risk factor. Using the diabetes risk factor to illustrate, a 1 percentage-point increase in diabetes among the patient population is associated with a 5.2% increase in COVID-19 hospitalization rates. Hence, a higher percentage for a risk factor indicates that it is more strongly associated with increased (orange) or decreased (blue) COVID-19 hospitalization rates.
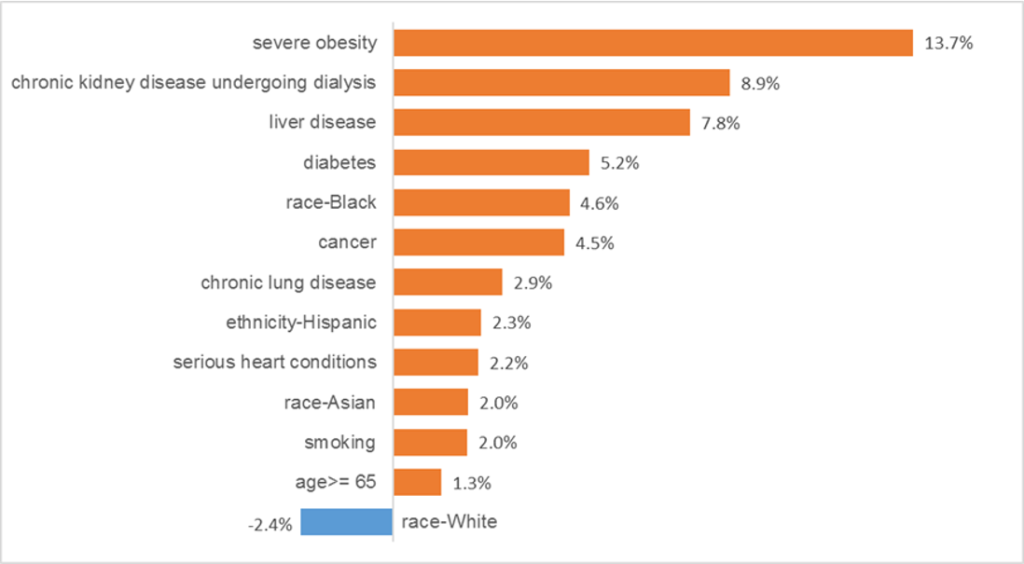
By far the risk factor found to be most strongly associated with higher COVID-19 hospitalization rates was severe obesity. This result suggests that for every 1 percentage-point increase in severe obesity among the population served, the COVID-19 hospitalization rate is 13.7% higher. As for race and ethnicity, the percentage of patients who are Black was the most strongly associated with changes in the COVID-19 hospitalization rate (4.6% increase in hospitalizations for every 1 percentage-point increase in Black patient population representation).
Discussion
Overall, our analyses validated the CDC Risk Factors for COVID-19 by demonstrating all those included were associated with higher hospitalization rates at the hospital level of analysis. The top three risk factors identified for hospital-level COVID-19 hospitalizations (severe obesity, chronic kidney disease, and liver disease) matched those identified in our county-level analysis of COVID-19 death rates. Furthermore, hospitals with higher proportions of Black, Asian, and Hispanic patients tend to have higher COVID-19 hospitalization rates.
Limitations
The hospital-level risk factors were estimated based on only persons who had visited a hospital during 2016-2018, and therefore may be a poor proxy for the distribution of risk factor across hospitals. In particular, risk factor information for people who never visited hospitals during this time period could differ from those who did, resulting in them being a poor proxy for the whole population potentially served. In addition, some cases had to be excluded because they lacked identification numbers that could be matched across data years. Hence, the proportion of risk factors in the study may be higher estimators than would be the case for the whole patient population. Furthermore, the number of COVID-19 hospitalizations for each hospital changed over time, but our study made use of the cumulative number of hospitalizations at a single point of time. Finally, some of the potential risk factors could not be coded from discharge data (e.g., HIV infection), and therefore were not included in the models.