About HQI’s Sentinel Signal Detection System Report
HQI’s sentinel signal detection system automatically detects abnormal changes (i.e., signals) in the incidence of diagnosis categories from hospital encounter records in the Hospital Quality Improvement Platform (HQIP). Every quarter, HQI aggregates these signals across reporting hospitals to provide a statewide perspective.
Emergency Department
With Q3 2024 encompassing the summer months, seasonal heat contributed to the types of conditions driving visits to the emergency department (ED) during this period. Heat exhaustion and heatstroke signaled an increase in cases, along with a spike of dengue fever. Patients verifying their pregnancy status and abdominal pain — the most common complaint for an ED visit — also signaled for a significant rise.
Ambulatory Surgery
In Q3 2024, the strongest signals are for arthroplasty, a surgical procedure that restores joint functionality. Musculoskeletal conditions like limb amputations and osteoarthritis also saw a notable uptick, and signals were noted for acute appendicitis, and uterine and cervical malformations. A signal revealed a significant increase in documenting family histories of illnesses, an important pre-procedure step. Thalassemia, a rare hematologic disorder, was also signaled during this period; this is likely reflecting its clinical relevance in preoperative evaluations, as maintaining appropriate hemoglobin levels is a critical criterion for minimizing complications in invasive surgical procedures.
HQIP provides hospital leaders with the capability to review the latest signals for their organization each quarter. In this report, these signals are aggregated across reporting hospitals and provided as counts representing a statewide signal.
As an example, consider these results for the ICD-10 category Z20:
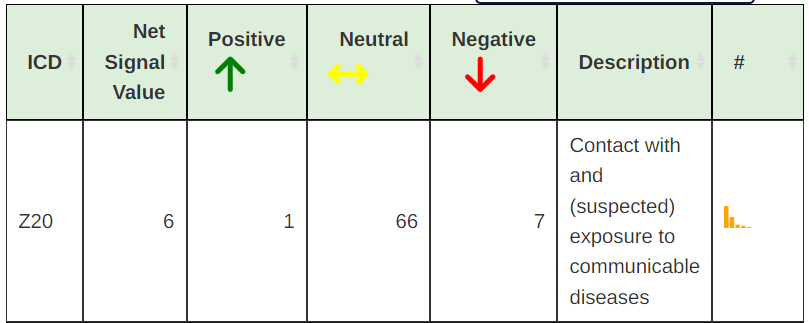
The ICD-10 category represents all ICD-10 codes that begin with these three characters.
The Positive column gives the number of reporting hospitals that had a statistically significant increase in the count of codes in this ICD-10 category for this quarter (i.e., the count of positive signals).
The Negative column gives the number of reporting hospitals that had a statistically significant decrease in the count of codes in this ICD-10 category for this quarter (i.e., the count of negative signals).
The Neutral column gives the number of reporting hospitals that did not see a statistically significant change in the count of codes in this ICD-10 category this quarter.
The Net Signal Value provided is the absolute difference between the number of Positive and Negative signals. The absolute difference is the difference between the two with a positive sign; a Positive Signal count of 20 and a Negative Signal count of 12 would lead to a Net Signal Value of 8 (as would a Positive Signal count of 12 and a Negative Signal count of 20).
The Description gives the text overview associated with this ICD-10 category.
The # category provides a bar chart with the quarterly counts of ICD-10 codes within this category among reporting hospitals. Hovering over each bar with a mouse cursor will provide a tooltip with the quarterly counts.